For consistency, we ask you to use the following URL (containing earthquakes between Nov 2011 and Feb 2012, listed from the most recent to least recent) in your program: http://mcs177.github.io/projects/earthquakedata-2012-02-23.txt.
The data's header contains:
- Date
- Time (in UTC)
- Latitude
- Longitude
- Magnitude
- Depth
dateLessThan
that takes two dates in the format YYYY/MM/DD (as string objects).
It returns True if the 1st date
comes strictly earlier than the 2nd date.
Otherwise, it returns False.
- You can assume that all input are valid dates in the format YYYY/MM/DD.
- You can use selection statements (if, elif, else)
and/or logical operators (and, or).
- Note: Your implementation should not be overly complicated.
In particular, it should contain no more than 2 nested selection (if) statements.
In fact, none of the procedures I wrote contains any nested selection statements.
- Hint: you've done something similar on Week 9 Tuesday.
- Test your procedure against different combinations of dates.
>>> dateLessThan("1999/01/01", "2000/05/15")
True
>>> dateLessThan("2000/05/15", "2005/05/01")
True
>>> dateLessThan("2017/01/01", "2010/07/01")
False
>>> dateLessThan("2013/10/24", "2013/9/24") # October is not earlier than September
False
betweenDates
that takes 3 dates (as string objects) in the format YYYY/MM/DD
and returns True if the 1st date is earlier/equal to the 2nd date AND
the 2nd date is strictly earlier than the 3rd date.
That is, if the 2nd date is between the 1st date (inclusive) and the 3rd date (exclusive).
Otherwise, it returns False.
- You may assume that all inputs are valid dates in the format YYYY/MM/DD.
- You must use the procedure
dateLessThanin a way that makes your implementation simpler. - Note: Your implementation should not be overly complicated.
In particular, it should contain no more than 2 nested selection (if) statements.
In fact, none of the procedures I wrote contains any nested selection statements.
- Test your procedure against various combinations of three dates.
>>> betweenDates("2000/05/15", "2000/05/15", "2005/05/01")
True
>>> betweenDates("2000/05/09", "2000/05/09", "2000/05/10")
True
>>> betweenDates("1999/05/09", "2000/05/09", "1999/05/09")
True
>>> betweenDates("2011/01/01", "2011/07/01", "2011/12/31")
True
>>> betweenDates("2000/05/15", "2000/05/15", "2000/05/15")
False
>>> betweenDates("2011/01/01", "2010/07/01", "2011/12/31")
False
>>> betweenDates("2011/01/01", "2011/12/31", "2011/12/31")
False
makeDataDictionary.
It takes in two string parameters.
The first one is in the form of a header (separated by commas), and the second one is the data (separated by commas).
It returns a dictionary with dictionary keys the words given from the header
and the dictionary values the data values (as string objects).
All leading and trailing spaces should be removed.
- Hint: your code may look similar to the `
makeDictionaryfunction from Project 5 (in this case, you have to first turn the two strings into two lists of strings which are stripped of leading and trailing spaces) -
Hint: In class, you learned various ways to remove leading and trailing spaces from a string.
- Comment: Since you had recently learned about list comprehension, you are welcome to use list comprehension in this procedure (see the end of Chapter 5 in the textbook or Python doc).
This is optional.
- Test your procedure against several different inputs.
>>> makeDataDictionary('State,HouseholdIncome,IQ,McCainVote,Region','Alaska,57071,99,0.602,W')
{'Region': 'W', 'State': 'Alaska', 'IQ': '99', 'HouseholdIncome': '57071', 'McCainVote': '0.602'}
>>> makeDataDictionary('day,  time,someinfo, magntd, depth', '2012/01/12,19:55:51.2,52.605,    , 50')
{'someinfo': '52.605', 'depth': '50', 'time': '19:55:51.2', 'day': '2012/01/12', 'magntd': ''}
>>> makeDataDictionary('1,2,3','val1,      ,   val3')
{'1': 'val1', '3': 'val3', '2': ''}
readEarthquakes that takes two dates in the format YYYY/MM/DD,
accesses the earthquakes from
http://mcs177.github.io/projects/earthquakedata-2012-02-23.txt
(taken from USGS).
It returns
a list of dictionaries for all earthquakes between the two dates,
except for earthquakes with missing magnitude information.
>>> L = readEarthquakes("2012/01/03", "2012/01/04")
>>> L[0]
{'Date': '2012/01/03', 'Longitude': '143.786', 'TimeUTC': '23:30:07.0', 'Magnitude': '4.6', 'Depth': '10', 'Latitude': '26.938'}
-
Note that each item of the returned list is a dictionary.
The keys of each dictionary should be be the same, given by the header of the data.
The values of each dictionary are read off from each line of the data.
- The beginning date is inclusive, and the ending date is exclusive,
just like in the procedure
betweenDates. Assume only valid dates in the form of YYYY/MM/DD are entered. - This procedure must call
makeDataDictionaryto create each dictionary, so that your function is not overly complicated. In fact, you should not have more than one loop in your implementation ofreadEarthquakes. - To further simplify your
readEarthquakesprocedure, it must use eitherdateLessThanorbetweenDatesto make sure that earthquakes are included in the returned list of dictionaries if and only if they have the correct dates. - If the first date is later or equal to the second date, return an empty list.
If the dates do not exist in the data, return an empty list.
-
NOTE: If you have the first-edition textbook, it has two errors that were corrected in the second-edition. First, the first-edition textbook has a typo: use
urllib.requestinstead ofurllib. Second, remember that you need to decode anything you read from the web. For example, if you read a string into a variablemyString, you can decode it by:decodedString = myString.decode() -
This is the only procedure that should be reading from the internet.
Hence, you may want to do
import urllib.requestwithin this function. (Remember also that you would run into problems if you run this procedure in Python 3.6). -
Some earthquakes do not have any information on the magnitude. You should not include these earthquakes in your returned list
by checking whether there is only an empty string in the place of magnitude.
-
Comment: Since you had recently learned about list comprehension, you are welcome to use list comprehension in this procedure (see the end of Chapter 5 in the textbook or Python doc).
This is optional.
colorCode that takes the depth of an earthquake and
returns the corresponding color for the earthquake.
| Range | Color |
| 0-33 | 'orange' |
| 34-70 | 'yellow' |
| 71-150 | 'green' |
| 151-300 | 'blue' |
| 301-500 | 'purple' |
| 501-900 | 'red' |
>>> colorCode(33)
'orange'
>>> colorCode(34)
'yellow'
Your procedure should not be overly complicated. In particular, don't include more than 2 nested selection statements.
cTurtle methods shown below to show a window showing the image link and draw several dots at 4-5 different locations with various colors and sizes.
-
You need all of the methods (except maybe
speed). You should not require any methods not mentioned below. - If you wish to work on your own laptops, you can download the
cTurtle module
and save it in the appropriate directory. To figure out the appropriate directory, see
https://mcs177.github.io/links.html
- Please start by creating a cTurtle object as follows:
>>> import cTurtle>>> myTurtle = cTurtle.Turtle()
-
To test that your image file worldmap.gif is saved in the correct directory,
run
>>> myTurtle.bgpic('worldmap.gif')which should cause the worldmap.gif image to be displayed.
-
To move your turtle, use
goto. To draw a dot, usedot.
| Method Contract | Description | Example |
# goto: number number -> void |
Moves the turtle to the given coordinate (x, y) | myTurtle.goto(10, 150) |
# dot: number string -> void |
Makea a dot of the given size with the given color at the current position | myTurtle.dot(30, 'blue') |
# down: -> void |
Put the turtle's tail down. Makes the turtle draw lines when it moves. | myTurtle.down() |
# up: -> void |
Raise the turtle's tail up. Prevents the turtle from drawing lines when it moves. | myTurtle.up() |
# speed: integer -> void |
Sets the speed of the turtle. 1 is slowest and 10 is fastest. | myTurtle.speed(10) |
# setWorldCoordinates: number number number number -> void |
Modify the world coordinates of the canvas that the turtle draws on. Automatically scale the canvas between (x1, y1) and (x2, y2). X values range from x1 to x2 while Y values range from y1 to y2. | myTurtle.setWorldCoordinates(-10, -5, 10, 5) |
# bgpic: string -> void |
Set the background of the canvas with the given image file | myTurtle.bgpic('worldmap.gif') |
# hideturtle: -> void |
Make the turtle invisible | myTurtle.hideturtle() |
plotEarthquakes that takes two dates and plots all the earthquake data from
http://mcs177.github.io/projects/earthquakedata-2012-02-23.txt
(taken from USGS) between the given dates
with dots on the world map.
- Assume that the dates are string objects that are valid dates in the form of YYYY/MM/DD.
- You must call the procedure
readEarthquakes. - You can use the procedure
dotfrom thecTurtlelibrary that takes the size and color. -
Please use the product of 4 and the magnitude for the size of dots.
Please use the depth for the right color.
The procedures
intandfloatmay also be useful for you here. -
As demonstrated above, the procedure
bgpicis useful to put the world map image in the background. -
The procedure
setWorldCoordinatescan help you plot the dots more easily.Assume the entire map shows -180 to 180 degrees from left to right and -90 to 90 degrees from bottom to top.
-
This is the only procedure that needs the
cTurtleobject. Hence, you may want to doimport cTurtlewithin this function. -
When you are debugging your work, you may want to use a short practice data (as opposed to the entire data).
For debugging purposes, you can use the two URLs:
http://mcs177.github.io/labs/earthquake_short.txt
and
http://mcs177.github.io/labs/earthquake_shortb.txt
It should take no more than a few seconds for the turtle to stop drawing the dots using these short practice URLs. It will go even faster if you remember to hide your tutle using the
hideturtleprocedure. -
When you feel fairly confident that your code is working as it should, you can test it by replacing your test URL with the actual URL.
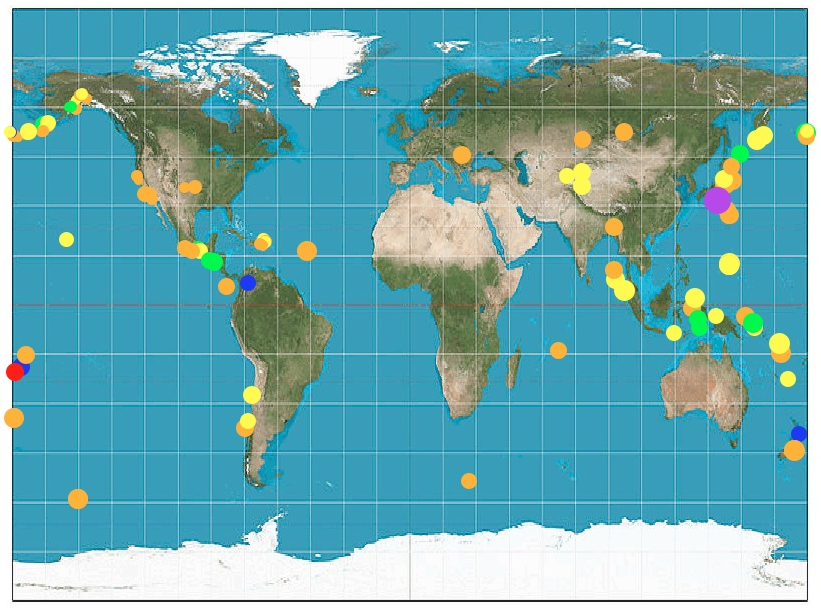
The following command
>>> plotEarthquakes("2012/01/01", "2012/01/04")should produce the following map with all the earthquakes for 3 days (January 1st, 2nd, and 3rd in 2012). It may take more than a few seconds for the turtle to finish drawing.

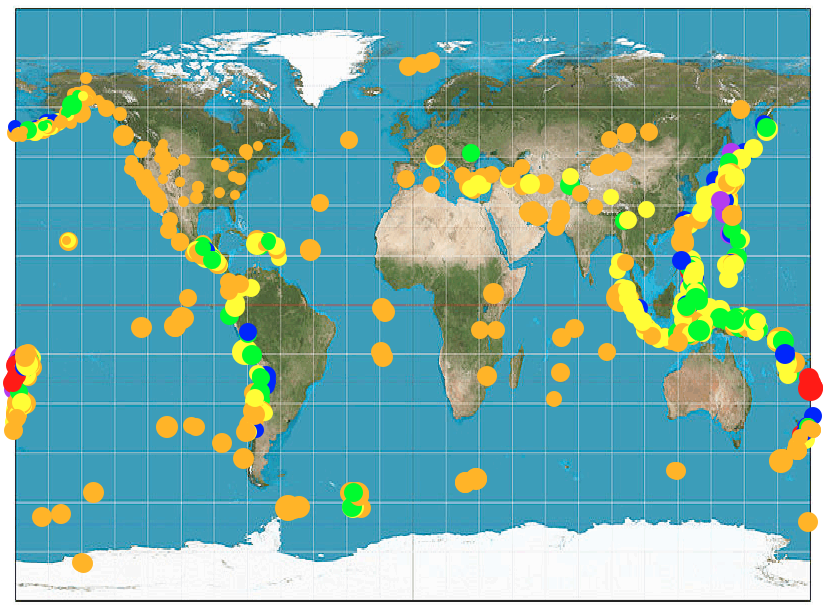
The following command (which may take several minutes)
>>> plotEarthquakes("2012/01/04", "2012/02/01")should produce the following map with all the earthquakes from January 4 until January 31 (inclusive). It may take more than a couple minutes for the turtle to finish drawing.
